ISOPlanner data can be surfaced in Microsoft Power BI to create interactive reports. Most data entities and relations between them can be used. For example, you can create a new report and add Risks, Controls and Tasks and the relations between them to quickly create a report which shows overdue monitoring tasks related to controls that mitigate risks with a high risk classification. These reports can be shown on a dashboard in ISOPlanner. You control who is authorized to view and share and all data remains in your Microsoft Power BI environment.
- ISOPlanner Business or Premium subscription.
- ISOPlanner Management User license.
- Power BI license. Click here for more information/pricing
Installation
We are currently working with Microsoft to certify our Power BI connector. Until this is process finished, the connector must be installed on the computer where you create your reports with Microsoft Power BI Desktop. In addition, to refresh the data of the reports periodically and automatically, the Microsoft On-premise Gateway must be installed and configured. These steps can be skipped when Microsoft has enough community feedback that this connector should be certified.
Get started
- Please check the requirement section above
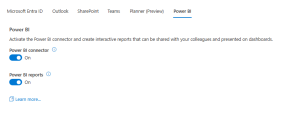
- In ISOPlanner, in the menu Administration / Settings / Tab: Integration, enable the Power BI integration and give the permissions.
- Install Microsoft Power BI Desktop from the Microsoft Store or contact your IT-department.
- Download the ISOPlanner BI connector here.
- This file (.mez) must be placed on your local computer where you want to create reports using Microsoft Power BI Desktop.
- After download, copy the file to your local [Documents]\Power BI Desktop\Custom Connectors. Create the folder if they do not exist. It can be a local folder on your C: drive or OneDrive. Please refer to the Microsoft documentation here. E.g C:\Users\Chris\OneDrive\Documents\Power BI Desktop\Custom Connectors\ISOPlannerBI.mez. Please note that your [Documents] folder is localized to your language.
- Start Microsoft Power BI Desktop
- Change the setting to allow loading custom connectors. Please refer to the Microsoft documentation here.
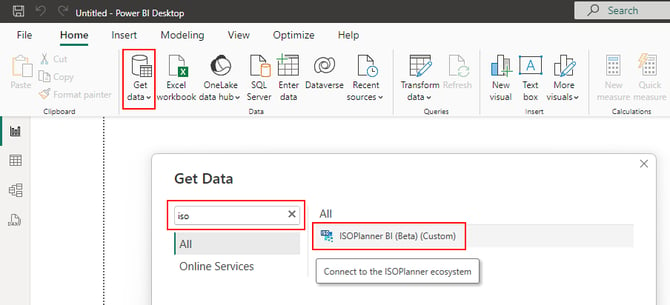
- Create a New report, click ‘Get data‘ in the toolbar, click More and search for ‘iso‘. The ISOPlanner BI connector should show. If not, please check step 5.
Your first report
- Start Microsoft Power BI Deskop
- Click New report, click ‘Get data‘ in the toolbar, click More and search for ‘iso‘.
- Select the ISOPlanner BI connector and click Connect.
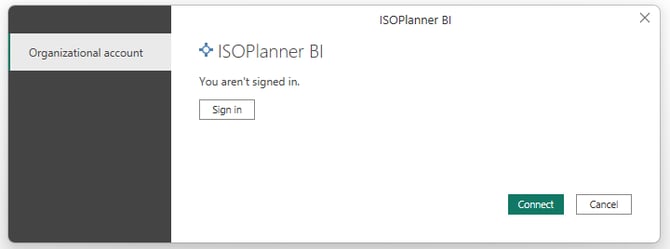
- Click Sign in and log in with your Microsoft work account (same as ISOPlanner).
- Grant the permissions to ISOPlanner SVC (our back-end service) to connect to ISOPlanner as you (user impersonation). These permissions allow only to ‘connect’ and do not request additional authorization. The actual authorization is enforced by your management license in ISOPlanner. (Users without this authorization will not be able to connect.)
- Click Connect.
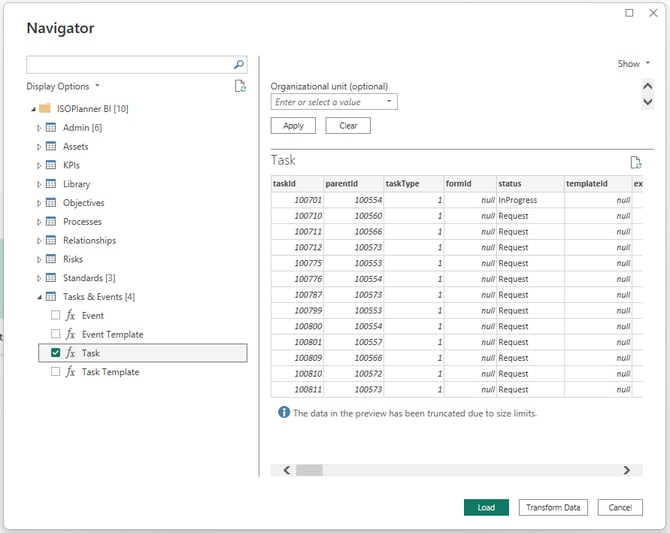
- The Navigator appears. Here you can select the data. Open the Tasks and Events section. Select Task and click Load.
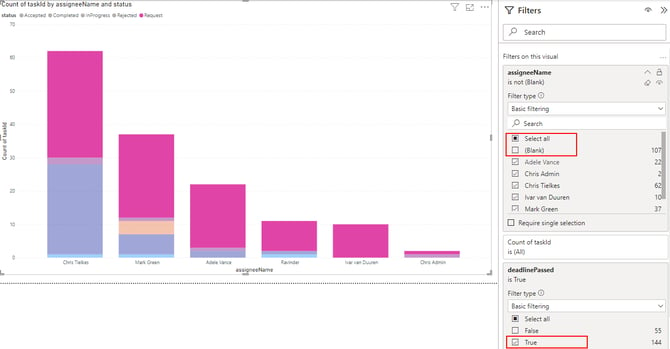
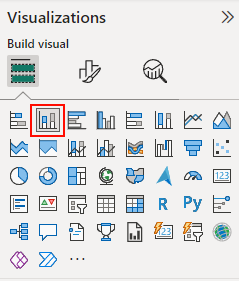
- Add a ‘Stacked column chart’ to the report.
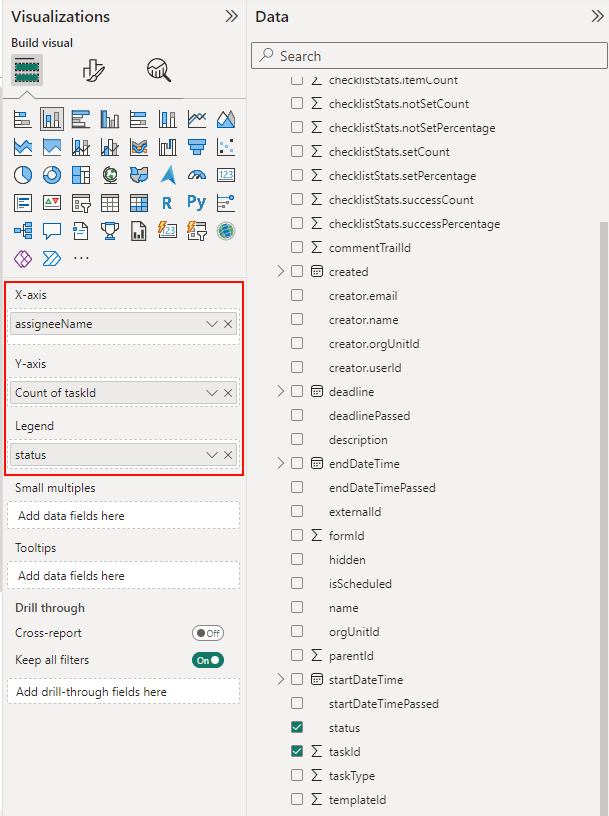
- In the Data pane, drag the field assigneeName to the X-axis and taskId to the Y-axis
- Drag the field status to the legend
- Drag the field deadlinePassed to the visual filters and select True as the only value.
- In the filter for assigneeName, select all fields except (Blank).
- Now you have created a report that shows all assigned tasks over deadline, grouped by assignee and stacked by status.